WIN Career Readiness System: Dashboards
When administrators / facilitators log into the portal, they can see various graphs relating to the products. The purpose of the dashboard is to provide information about learner progress quickly and efficiently.
Header Action Items
There are several options across the top of the dashboard. The data range and print button will appear on each page within the portal. These are referred to as action items. Tool tips and data explanations will appear when hovering over a link or button and the data respectfully.
- Dashboard will always bring you back to the dashboard view.
- Reports allow access to all reports within the portal. Choose a report to generate from the dropdown list.
- Resources opens the WIN Learning Resources page for support materials and additional program information.
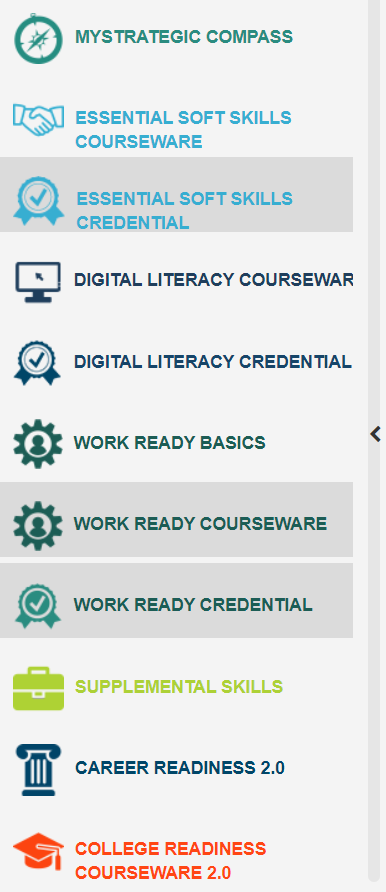
- Products provides access to the learning courses from a dropdown menu. Access to courses is determined by your WIN Learning contract.
- Admin allows access to User Administration or Organization Administration.
- Calendar
 is used to set data ranges for dashboard data. Select the date range to display. All dashboard reports will default to the specific dates chosen. The date range stays static until it is changed.
 - Print Icon
 prints PDF’s of the dashboard data.
 - User Profile
 is used to change passwords and see permission rights within the portal.
 - Envelope Icon
 displays contact information for the Support Team.
 - Arrow Icon
 is the log out button. Always use this button to exit the program.
 - Bell Icon
 is for notifications and pertinent information. There will be green bubble to indicate unread notifications.

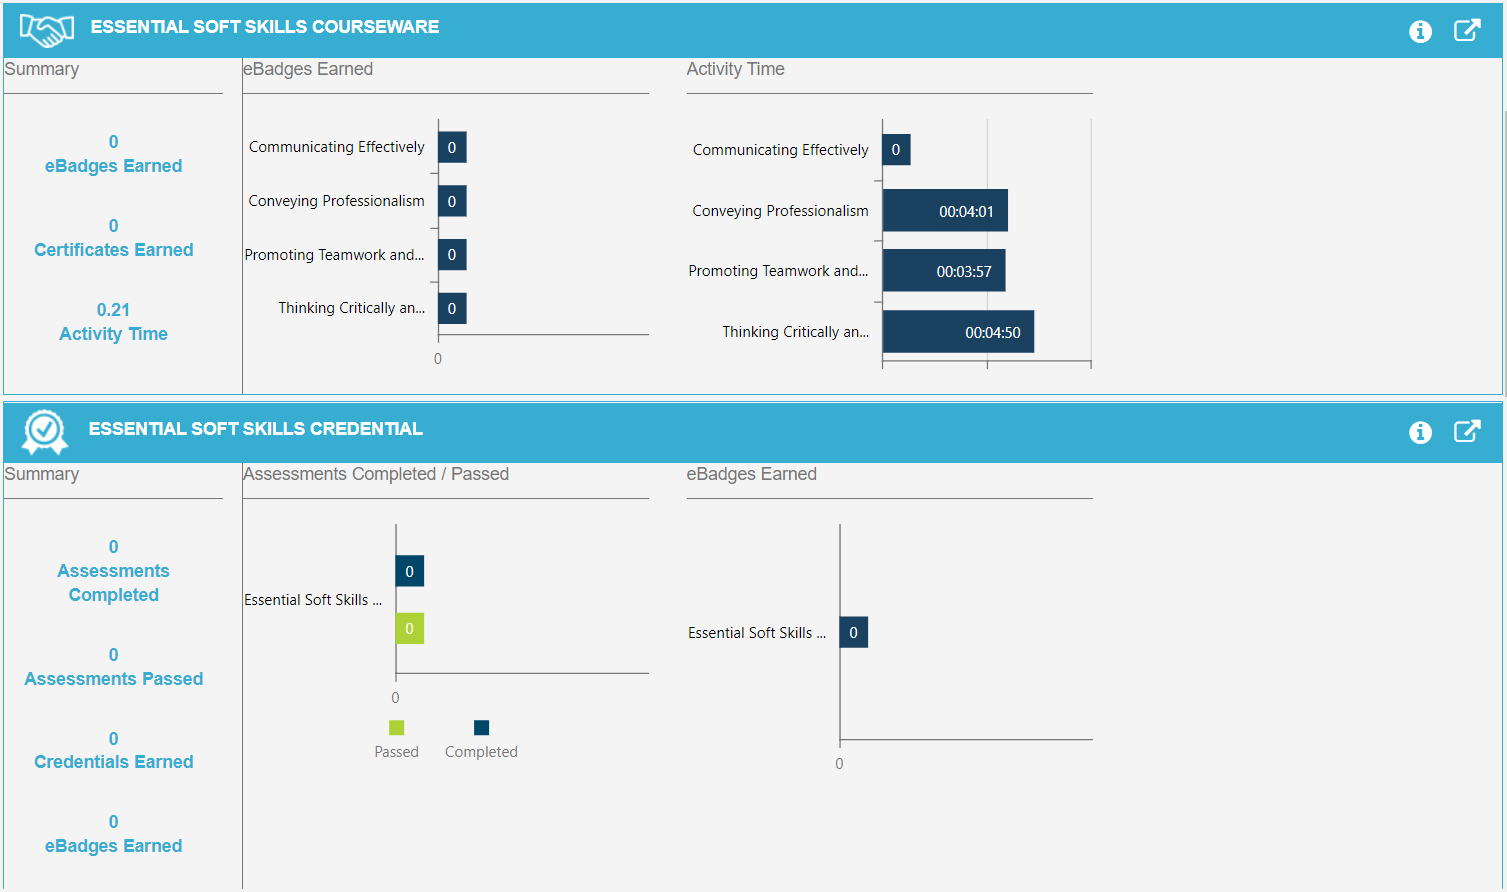
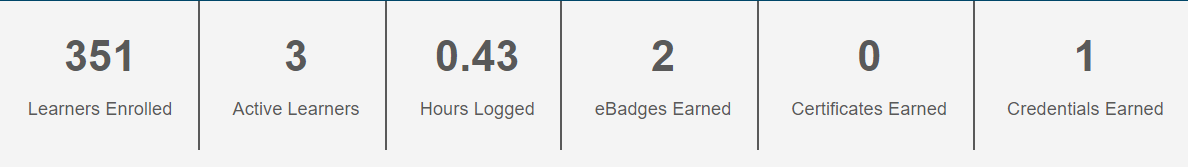
Data at a Glance
At the top of the data graphs, total activity during the date range is displayed. This includes number of learners enrolled, number of active learners, hours logged, total eBadges earned, total Certificates earned and total Credentials earned. These numbers reflect usage over all courses and assessments. These boxes change depending upon your program access.
Portal Personalization
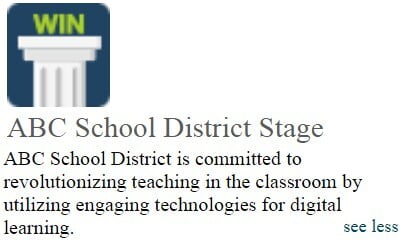
There is an option to personalize the WIN Learning portal with a logo and program description. This is client choice. Choose see less to minimize the description.
Display Data Charts
Data charts provide timely data for each product based upon the date range selected. The first column is always a summary of activity. The other columns provide more granular data for benchmarks within the courses or assessments. Hover over each graph component to see totals and percentages. Percentages indicate overall performance within each category.
Use the up-arrow button on the far right to navigate to that course or assessment.
Select the information icon to see more information about each product.

Additional Data
For additional data, go to Reports. The Reports tab will display a list of reports to see individual student progress and summary reports. These reports can be downloaded and saved. Review the different reports from the WIN Career Readiness System homepage.